“Metrics facilitate understanding and collaboration”
Put your creative stiffy back in your pants.
Not likely! As soon as you read that first sentence your brain probably started to switch off. Metrics are probably not the first thought that come to mind when you think about marketing.
“When you can measure what you are speaking about, and express it in numbers, you know something about it; but when you cannot measure it, when you cannot express it in numbers, your knowledge is of a meager and unsatisfactory kind”––William Thomson, Lord Kelvin.
Kelvin, who was in charge of managing the laying of the first successful transatlantic cable, was one of history’s great advocates for quantitative investigation. However, in his time numerical rigor hadn’t yet gone outside of finance, engineering and science.
Today you would be hard pressed finding a leader in any business who didn’t rely on numbers.
“What gets measured, gets done!”
“If you can’t measure it, you can’t manage it.”
Cliche quotes of the last 40 years.
Yet, it is hard to deny the significance they play.
The biggest problem for most of us is we don’t what marketing metrics are important and what questions they actually answer.
Companies like Buffer (grew to more than $10,000,000 in just over 5 years!) have done some amazing things by knowing their numbers. Checkout this case study from Jaakko. It shows exactly what can be inferred when you have good metrics.
That’s why we have broken down the most important digital marketing metrics and exactly how to calculate them.
The Essential List Of Digital Marketing Metrics
Leads received in the last X days (AKA “Lead Volume”)
- It simply shows you how many leads you are generating.
- For most early stage businesses or those with stagnating growth your biggest problem is normally getting enough leads. There should be no need to worry about sales until you are overrun with leads.
- The best way to start getting more leads is to have the problem front of mind. So be sure to measure this metric with regular frequency.
- Pick up a time period for your X days. If you are unsure pick a shorter one and start using it.
- Compare this metric to a previous time period. E.g. 12 leads received in the last 30 days. This is 3 more than the previous period.
- For a seasonal business probably compare to the prior year rather than the month previous
[cta id=”2091″ vid=”0″]
Lead-To-Customer Conversion Ratio
- A ratio metric that shows you how many leads are turning into customers.
- This tells you if your sales process is working or not.
- It could also indicate you are not getting the right type of leads or the handover from lead generation to sales is not working.
CPL: Cost-Per-Lead
- This is either the cost of generating a lead in total or for specific campaigns or marketing channels.
- You should aim to be generating leads as efficiently as possible.
- The higher this is the more it eats into your Customer Lifetime Value
- Calculate this with the following formula: Total investment on marketing campaigns / total leads generated
Return On Marketing Investment
- A quick metric to look at which provides a meaningful measurement of a campaign’s success.
- Answers the question “Did this marketing campaign / channel produce a positive monetary result?”
- Normally those with the highest ROI, are the ones you should double down your efforts on.
- Bonus points if the marketing campaign is not only positive ROI but cashflow positive too 🙂
- Calculated as:
[Incremental Revenue Attributable to Marketing ($) * Contribution Margin (%) – Marketing Spending ($)] /
Marketing Spending ($)
Social Media Publishing Volume
- Average number of posts or tweets for a particular platform over a period of time.
- In order to get results from social media, you need to show up often. So if you are not putting out posts or tweets (of value!) than you are handicapping your results.
- When buffer broke down the anatomy of a successful Facebook post, they included regular posting for a reason – it matters.
Amplification Rate
- This the rate at which your followers take your content and share it through their network. The higher the amplification rate, the further the content will reach.
- Most marketing channels have limitations, and the reach of each channel is normally limited to the ads or impressions you can buy.
- The great part about social media is it allows you to break free of limitations. If you provide something which is “entertaining / informative / provides utility” it will spread around and be its reach will be AMPLIFIED.
- Calculated as: Number of shares per post
- Can be calculated across a time period, simply take total number of shares for that time period across all posts and divide by the number of posts.
- There are no great tools to make life easier in calculating this. We recommend using Google sheets or Excel.
For a truly in-depth look at the social media metrics of conversation, amplification and applause rate, Avinash’s post is essential reading.
Non-Branded Clicks From Organic Search
- Tells you the number of people who were searching for services you provide and found your business.
- A simple measure of success of your SEO. Yes, it is a good idea to know how many of your keywords are in the top 3 positions of Google, but if the keywords which you selected to rank for were rubbish to begin with (no search volume) than ranking in Google won’t translate into more traffic from organic search.
- For some businesses you might need to exclude the clicks from organic search to the business blog. Though this depends on the goals of your business blog.
- You won’t find the numbers needed for this in Google Analytics anymore.
- You can however get the numbers you need to measure this from Google Webmaster Tools, now known as Google Search Console.
- Formula is:
Branded Clicks From Organic Search
- How many people found “YOU” by searching on Google.
- A metric which provides a good indication of Word Of Mouth and brand awareness.
- It is helpful if you run campaigns offline which are not easily measured through the checkout (e.g. coupons) or on-site cookies.
- Branded Clicks From Organic Search = Brand Name Search + Misspellings Of Brand Name + Names Of Products Or Services Which Are Unique To Your
- Business
- Again, this data is found through Google Search Console. It should be as simple as creating a list of all the common terms and putting it into a spreadsheet. Once you have done this the first time, you should simply be able to download the data and drag and drop a VLOOKUP formula.
IF this last bit on VLOOKUP sounded like jibberish, there is an excellent 7 minute video below. You can do the same thing in Google Sheets too. Once you learn this technique once, you will use it MANY times again! Anytime you are exporting and categorising data, this is normally the solution to automate it.
Position Of Targeted Keywords In Search
- Shows you how your keywords are ranking in search
- The first thing to understand is this information is most useful as a KPI for whoever is responsible for SEO. Good metrics are ones which can be influenced, and whoever is responsible for SEO can influence the search rankings. Whereas holding them accountable for something like ‘website traffic’ is not as meaningful.
- There is no formula for this one. You could track it manually, however it is best tracked through a rank tracking tool like SERP book. You can simply share a link to view the rankings with the team.
Bounce Rate
- A metric of the number of people who leave the website after only viewing one page.
- Bounce rate is a good measurement for landing page optimisation. If someone arrives on a page and does anything (e.g. hitting a play button on a video or proceeding in a funnel) it triggers a hit in Google Analytics and is not a bounced session.
- Bounce rate is useful as a metric for paid advertising. If you are paying to get someone to a page and they do nothing when they get there, that is money down the toilet.
- For a content only website, bounce rate is also important. Are people coming and reading one article and leaving? Or are they becoming loyal and reading multiple articles?
- While bounce rate is useful for those reasons. It is not the best measurement of a pages value. As the way bounce rate is measured in Google Analytics is quite deceiving. The best measurement of that is page value!
- You can add this small piece of code to your Google Analytics in order to fix up how Google Analytics calculates bounce rate.
- Bounce rate is closely associated with page speed. A slow page speed = high bounce rate.
- The best way to further investigate why a particular page might be ineffective is through screen recordings and heat maps of users. Give hotjar a whirl. It is simple to use and seriously powerful.
Quality Score
- For several online Pay Per Click advertising platforms they provide a measure of Quality Score.
- Google Adwords call it quality score, Facebook calls it Relevance Score.
- It gives a rating as to how relevant the ad and page the person lands on is to the people who see the ad.
- The better you score the lower your cost per click or impression will be, as you are deemed to be providing the most relevant ad to the platform’s audience.
Conversion Rate
- A percentage metric which shows of the number of people who visited a page, what percentage took the desired action.
- People often ask “What is a good conversion rate?”. This is influenced by so many factors that there is no across the board answer. Sometimes 2% is good, sometimes 35% is good.
- You can see many answers to this question for different industries on Quora. There is great answer for ecommerce conversion rate there too.
- Once you have conversion rate you really need to take this a step further and show the conversion rate by marketing channel. It provides more actionable insight.
Total Conversions
- The number of visitors who took an action on the website.
- This number should be seen alongside conversion rate for each channel.
- You absolutely must familiarise yourself with the difference between micro and macro conversions.
Referral Traffic Growth
- Which other websites are sending traffic to yours and how much has this grown or declined.
- Tells you where you need to refocus your efforts
CTR (Click-Through-Rate)
- A measure of the effectiveness of advertising in getting people to click
- Discover what is enticing people to click on the ads and repeat the process over and over again.
- CTR = Number of click-throughs / Number of ad impressions
- Be careful on the Facebook ad platform to understand the difference between the number of Facebook click vs the number of website clicks.
If you are looking for a list of metrics which skims the surface quickly, I have embeded a nice little slideshare below.
What Shouldn’t Be Measured?
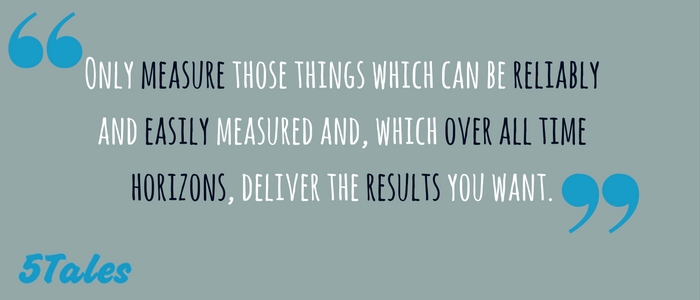
It is criminal to measure nothing, but can almost be as large of a crime to measure too much. A simple mantra to keep in mind when knowing what to measure:
So let’s take two examples:
- Customer Lifetime Value (CLTV)
- Unsubscribe Rate from emails
Customer LifeTime Value fails the test for most smaller organisations (or complex ones) because it is not easily measured. Therefore it needs to either be estimated to the point of usefulness or only estimated at an infrequent interval.
Unsubscribe rate also fails the test and is not worth measuring. These seems like an odd thought at first, however you should not be optimising what you say in an email to those people who do not want to listen to your message. You are better off focusing on getting more email addresses of people who want to hear from you.
[cta id=”2091″ vid=”0″]